National Ambient Air Quality Standards (NAAQS)
(Added 8/8/2021)
Extracted from the United States Environmental Protection Agency (EPA)
NAAQS Table
The Clean Air Act, which was last amended in 1990, requires EPA to set National Ambient Air Quality Standards (40 CFR part 50)
for six principal pollutants ("criteria" air pollutants) which can be harmful to public health and the environment. The Clean Air
Act identifies two types of national ambient air quality standards. Primary standards provide public health protection,
including protecting the health of "sensitive" populations such as asthmatics, children, and the elderly. Secondary standards
provide public welfare protection, including protection against decreased visibility and damage to animals, crops, vegetation,
and buildings.
Periodically, the standards are reviewed and sometimes may be revised, establishing new standards. The most recently
established standards are listed below. In some areas of the U.S., certain regulatory requirements may also remain for
implementation of previously established standards.
Units of measure for the standards are parts per million (ppm) by volume, parts per billion (ppb) by volume, and micrograms
per cubic meter of air (µg/m
3
).
(1) In areas designated non-attainment for the Pb standards prior to the promulgation of the current (2008) standards, and for
which implementation plans to attain or maintain the current (2008) standards have not been submitted and approved, the
previous standards (1.5 µg/m
3
as a calendar quarter average) also remain in effect.
(2) The level of the annual NO
2
standard is 0.053 ppm. It is shown here in terms of ppb for the purposes of clearer comparison
to the 1-hour standard level.
(3) Final rule signed October 1, 2015, and effective December 28, 2015. The previous (2008) O
3
standards are not revoked and
remain in effect for designated areas. Additionally, some areas may have certain continuing implementation obligations under
the prior revoked 1-hour (1979) and 8-hour (1997) O
3
standards.
(4) The previous SO
2
standards (0.14 ppm 24-hour and 0.03 ppm annual) will additionally remain in effect in certain areas: (1)
any area for which it is not yet 1 year since the effective date of designation under the current (2010) standards, and (2)any
area for which an implementation plan providing for attainment of the current (2010) standard has not been submitted and
approved and which is designated nonattainment under the previous SO
2
standards or is not meeting the requirements of a
SIP call under the previous SO
2
standards (40 CFR 50.4(3)). A SIP call is an EPA action requiring a state to resubmit all or part of
its State Implementation Plan to demonstrate attainment of the required NAAQS.
Menu of Control Measures for NAAQS Implementation
The Menu of Control Measures (MCM) provides state, local and tribal air agencies with the existing emission reduction
measures as well as relevant information concerning the efficiency and cost effectiveness of the measures. State, local and
tribal agencies will be able to use this information in developing emission reduction strategies, plans and programs to assure
they attain and maintain the National Ambient Air Quality Standards (NAAQS). The MCM is a living document that can be
updated with newly available or more current data as it becomes available.
Menu of Control Measures
Posted: 8/8/2021


Pollutant
[Links to historical tables of
NAAQS reviews
Primary/
Secondary
Averaging
Time
Level
Form
Carbon Monoxide (CO)
primary
8 hours
1 hour
9 ppm
35 ppm
Not to be exceeded more than once per
year
Lead (Pb)
primary and secondary
Rolling 3 month average
0.15 mg/m
3 (1)
Not to be exceeded
Nitrogen Dioxide (NO
2
)
primary
primary and secondary
1 hour
1 year
100 ppb
53 ppb
(2)
98th percentile of 1 hour daily maximum
concentrations, averaged over 3 years
Annual Mean
Ozone (O
3
)
primary and secondary
8 hours
0.070 ppm
(3)
Annual fourth-highest daily maximum 8-
hour concentration, averaged over 3
years
Particle Pollution (PM)
PM
2.5
primary
secondary
primary
and secondary
PM
10
primary
and secondary
1 year
1 year
24 hours
24 hours
12.0 mg/m
3
15.0 mg/m
3
35 mg/m
3
150 mg/m
3
annual mean, averaged over 3 years
annual mean, averaged over 3 years
98th percentile, averaged over 3 years
Not to be exceeded more than once per
year on average over 3 years
Sulfur Dioxide (SO
2
)
primary
secondary
1 hour
3 hours
75 ppb
(4)
0.5 ppm
99th percentile of 1-hour daily maximum
concentrations, averaged over 3 years
Not to be exceeded more than once per
year
HEAT INDEX FORMULA
(Updated 15 February 2019)
The Heat Index "Equation"
(or, More Than You Ever Wanted to Know About Heat Index)
Lans P. Rothfusz
Scientific Services Division
NWS Southern Region Headquarters, Fort Worth, TX
When summer spreads its oppressive ridge over most of the United
State's Southern Region, NWS phones ring off their hooks with
questions about the Heat Index. Many questions regard the actual
equation used in calculating the Heat Index. Some callers are
satisfied with the response that it is extremely complicated. Some
are satisfied with the nomogram (see chart).
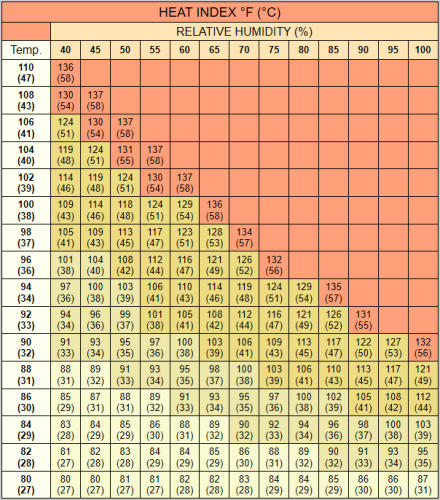
Chart by Lans Rothfusz, MIC at NWS Tulsa, OK
But, there are a few who will settle for nothing less than the equation
itself. No true equation for the Heat Index exists. Heat Index values
are derived from a collection of equations that comprise a model. This
Technical Attachment presents an equation that approximates the
Heat Index and, thus, should satisfy the latter group of callers.
The Heat Index (or apparent temperature) is the result of extensive
biometeorological studies. The parameters involved in its calculation
are shown below (from Steadman, 1979). Each of these parameters
can be described by an equation but they are given assumed
magnitudes (in parentheses) in order to simplify the model.
# Vapor pressure. Ambient vapor pressure of the atmosphere. (1.6 kPa)
# Dimensions of a human. Determines the skin's surface area. (5' 7" tall, 147
pounds)
# Effective radiation area of skin. A ratio that depends upon skin surface area.
(0.80)
# Significant diameter of a human. Based on the body's volume and density. (15.3
cm)
# Clothing cover. Long trousers and short-sleeved shirt is assumed. (84%
coverage)
# Core temperature. Internal body temperature. (98.6°F)
# Core vapor pressure. Depends upon body's core temperature and salinity. (5.65
kPa)
# Surface temperatures and vapor pressures of skin and clothing. Affects heat
transfer from the skin's surface either by radiation or convection. These values
are determined by an iterative process.
# Activity. Determines metabolic output. (180 W m-2 of skin area for the model
person walking outdoors at a speed of 3.1 mph)
# Effective wind speed. Vector sum of the body's movement and an average wind
speed. Angle between vectors influences convection from skin surface (below). (5
kts)
# Clothing resistance to heat transfer. The magnitude of this value is based on the
assumption that the clothing is 20% fiber and 80% air.
# Clothing resistance to moisture transfer. Since clothing is mostly air, pure vapor
diffusion is used here.
# Radiation from the surface of the skin. Actually, a radiative heat-transfer
coefficient determined from previous studies.
# Convection from the surface of the skin. A convection coefficient also
determined from previous studies. Influenced by kinematic viscosity of air and
angle of wind.
# Sweating rate. Assumes that sweat is uniform and not dripping from the body.
As an aside, these assumptions are important for the forecaster to keep in mind.
For example, a common perception is that wind is not taken into account in the
Heat Index. In actuality it is. It is assumed to be 5 knots. This may seem trivial but
a forecaster may be able to use this information creatively when writing Public
Information Statements regarding heat stress, heat stroke, etc.
# Ventilation rate. The amount of heat lost via exhaling. (2-12%, depending upon
humidity)
# Skin resistance to heat transfer. A function of activity, skin temperature, among
others.
# Skin resistance to moisture transfer. A function of the vapor-pressure difference
across the skin (and, therefore, relative humidity). It decreases with increasing
activity.
# Surface resistance to heat transfer. As radiation and convection from the skin
increases, this value decreases.
# Surface resistance to moisture transfer. Similar to heat transfer resistance but
also depends upon conditions in the boundary layer just above skin's surface.
These last five variables are used explicitly to derive the apparent
temperature. By an iterative procedure which relies on the
assumptions in the first list, the model is reduced to a relationship
between dry bulb temperature (at different humidities) and the skin's
resistance to heat and moisture transfer. Since these resistances are
directly related to skin temperature, we now have a relationship
between ambient temperature and relative humidity versus skin (or
apparent) temperature. As a result of this procedure, there is a base
relative humidity at which an apparent temperature (e.g., 90°F) "feels"
like the same air temperature (90°F). Increasing (decreasing) humidity
and temperature result in increasing (decreasing) apparent
temperature, and, yes, apparent temperature can be lower than air
temperature. Steadman (1979) developed a table based on this
relationship and the nomogram (above) summarizes that table.
In order to arrive at an equation which uses more conventional
independent variables, a multiple regression analysis was performed
on the data from Steadman's table. The resulting equation could be
considered a Heat Index equation, although it is obtained in a "round-
about" way. Thus, here is an ersatz version of the Heat Index
equation:
HI = -42.379 + 2.04901523T + 10.14333127R - 0.22475541TR -
6.83783x10
-3T2
-5.481717x10
-2R2
+ 1.22874x10
-3T2R
+ 8.5282x10
-4TR2
- 1.99x10
-6T2R2
where T = ambient dry bulb temperature (°F), R = relative humidity
(integer percentage)
Because this equation is obtained by multiple regression analysis, the
heat index value (HI) has an error of ±1.3°F. Even though temperature
and relative humidity are the only two variables in the equation, all
the variables on the lists above are implied.
References
Steadman, R.G., 1979: The assessment of sultriness. Part I: A
temperature-humidity index based on
human physiology and clothing science. J. Appl. Meteor., 18, 861-873.