NWS Weather Conditions
Station Measurement Definitions & Calculations
(Updated 20210808)
NATIONAL WEATHER SERVICE WEATHER CONDITION DEFINITIONS
Blizzard (BLZD): Sustained wind or frequent gusts of 35 mph or greater; and considerable falling and/or blowing snow (i.e.,
reducing visibility frequently to less than 1/4 mile. These conditions must persist for 3 hours or longer in order for the storm to be
classified as a blizzard.
Blowing Snow Advisory: Issued when wind driven snow reduces surface visibility, possibly hampering travel. Blowing snow may
be falling snow, or snow that has already accumulated but is picked up and blown by strong winds. This advisory was discontinued
beginning with the 2008-2009 winter storm season, replaced by the "Winter Weather Advisory for Snow and Blowing Snow."
Heavy Snow: Snowfall accumulating to 4" or more in depth in 12 hours or less; or, snowfall accumulating 6 inches or more in
depth in 24 hours or less.
Heavy Snow Warning: May be issued instead of a Winter Storm Warning when heavy snow is the only significant winter weather
expected. Issued by the National Weather Service when snowfall of 6" or more in 12 hours or 8" or more in 24 hours is either
imminent or occurring. These criteria are specific for the Midwest and may vary regionally.
High Wind Advisory: Issued by the National Weather Service when high wind speeds may pose a hazard. The criteria varies from
state to state. In Michigan, for example, the criteria is sustained non-convective (not related to thunderstorms) winds greater than
or equal to 30 mph lasting for one hour or longer, or winds greater than or equal to 45 mph for any duration.
High Wind Warning: Issued by the National Weather Service when high wind speeds may pose a hazard or is life threatening.
Criteria varies from state to state. In Michigan, for example, the criteria is sustained non-convective (not related to thunderstorms)
winds greater than or equal to 40 mph lasting for one hour or longer, or winds greater than or equal to 58 mph for any duration.
Ice Storm Warning: May be issued instead of a Winter Storm Warning when significant ice accumulation is the only significant
winter weather expected. Issued by the National Weather Service when freezing rain produces a significant and possibly damaging
accumulation of ice. The criteria for this warning varies from state to state, but typically will be issued any time more than 1/4" of
ice is expected to accumulate in an area.
Wind Chill Advisory: The National Weather Service issues this product when the wind chill could be life threatening if action is not
taken. Criteria varies from state to state. Had been known to be issued when wind chills of -15 to -24 degrees are expected.
Wind Chill Warning: Issued when the wind chill is life threatening. Varies from state to state. For example, had been Issued when
wind chills of -25 degrees or below are expected.
Winter Storm Warning: Issued by the National Weather Service when a winter storm is producing or is forecast to produce heavy
snow or significant ice accumulations. The criteria for this warning can vary from place to place, and can include expected
conditions such as a combination of heavy snow, freezing rain, sleet, blowing & drifting snow or excessive wind chill.
Winter Storm Watch: Issued to inform the public of the possibility that one or more of the following events may occur. Product is
issued b the National Weather Service when there is a potential for heavy snow or significant accumulations, usually at least 24-36
hours in advance. The criteria for this watch can vary from place to place, but generally includes the following possibilities:
•
Blizzard conditions
•
Heavy snow
•
Excessive wind chill
•
Significant accumulations of ice or sleet.
A Winter Storm Watch is usually issued 24-36 hours in advance of the possible event.
Winter Weather Advisory: A Winter Weather Advisory is issued by the National Weather Service of the United States when a low
pressure system produces a combination of winter weather that presents a hazard, but does not meet warning criteria. A Winter
Weather Advisory is similar to significant weather advisory, but a winter weather advisory is an official product. A similar warning is
issued by Environment Canada's Meteorological Service of Canada offices.
Winter Weather Advisory for Snow and Blowing Snow: Issued when wind driven snow reduces surface visibility, possibly
hampering travel. Blowing snow may be falling snow, or snow that has already accumulated but is picked up and blown by strong
winds. This advisory was implemented beginning with the 2008-2009 winter storm season, replacing the "Blowing Snow Advisory."
STATION MEASUREMENTS/CALCULATIONS
Atmospheric Pressure - The weight of the air making up our atmosphere exerts a pressure on the surface of the earth. This
pressure is known as "Atmospheric" pressure. Generally, the more air above an area, the higher the atmospheric pressure. The
amount of atmospheric pressure is therefore different at different altitudes. Atmospheric pressure is less on a mountain top than
it is at sea level. The atmospheric pressure as measured at sea level is assigned the standard value of one (1) atmosphere, and is
equal to 14.6959488 pounds per square inch. One standard used to ascertain the atmospheric pressure is a device known as a
mercury barometer. A mercury barometer has a glass column, or tube, that's on average 30 inches in height. It is closed or sealed
at the top, but open at the bottom where it is part of a mercury filled reservoir. The mercury in the tube adjusts its level until the
weight of the mercury is equal to the atmospheric force applied to the mercury in the reservoir. Atmospheric pressure is not a
constant at any fixed location, but will vary with changing weather conditions. As the weight of the atmosphere changes due to
weather, the level of the mercury in the tube would then also vary accordingly. High pressure conditions force more mercury into
the tube, while lower pressures result in less mercury in the tube. The height of the mercury in the tube is measured in inches. A
standard atmosphere of 1, or 14.69 lbs per square inch, will raise the level of the mercury to a height of 29.92 inches at sea level.
Thus, we have the standard measurement on what we would call a standard (dry) day of 29.92" of Mercury, or 29.92" Hg, of
atmospheric pressure, which equates to 14.6959488 lbs/in
2
.
The United States and Britain still use these older measurement units. In 1960 the International System of Units, SI, was
developed. This system of units is based upon the metric meter/kilogram/second (mks) system, which Britain and the USA are
both slow to embrace.
Pressure as measured in the SI "mks" system is defined in terms of the Pascal, and equals a force of one Newton per square meter
(in turn, a Newton is the force required to give a 1 kilogram mass an acceleration of 1 meter per second per second.) The Pascal is
a very small amount of pressure, so we often use KiloPascals (kPa), equal to one thousand Pascals. Using the SI system of units,
one atmosphere is equal to 101.325 kPa, or 101,325 Pa.
The sciences (meteorology) involving weather have adopted the "bar" as the unit of pressure measurement in addition to the old,
standard "English" units. A "bar" is equal to 1x10^5 Pascal. This pressure is most often expressed in terms of millibars of pressure
to avoid using a lot of decimal points. A pressure of 1 atmosphere is equal to 1000 millibars or 1 bar. If you run the math, you'll see
then that a standard atmospheric pressure, as defined using English units of measurement of 29.92" of Hg, or 14.69 pounds per
square inch, is equal to 1 bar or 1,000 millibars under the SI system.
Barometric Pressure - Atmospheric pressure varies with both altitude and weather changes. At sea level, given a standard day
(implies dry air), we will measure an atmospheric pressure of 29.92" of Mercury (29.92" Hg), or 1 bar (1000mb). At that very same
moment in time, if you measure the atmospheric pressure at an altitude of 5,000 feet (Denver, etc.), you will measure an
atmospheric pressure of only 24.89" Hg (or only 12.23 pounds square inch). The pressure in SI units at 5,500 feet is 827 millibars.
To work from a common reference point, Meteorologists are interested in measuring the changes in atmospheric pressure due
only to the effects of weather phenomenon and must therefore somehow discount pressure values effected by differences in
altitude. To normalize the effects of altitude on atmospheric pressure, i.e., to compensate for differences in pressure readings
associated with different altitudes at different locations, atmospheric pressure is converted to an equivalent pressure referenced
to sea level. This referenced measurement has been assigned the name "Barometric" pressure. Our station actually measures
atmospheric pressure then converts this value to barometric pressure based upon our altitude (5445 feet). Atmospheric pressure,
and subsequently Barometric pressure as well, is in America generally measured in units of Mercury. We use the standard of 1
atmosphere being able to push a column of mercury up a tube to a level of 29.9246899 inches of mercury. Therefore, when the
barometric pressure of one atmosphere at sea level is measured to be 29.92" of Hg, then our station at our altitude will report an
equivalent of that value (one atmosphere), i.e., 29.92" of Hg in spite of our altitude, given all other parameters remain constant.
Now, we can follow barometric pressure changes with local weather conditions, making this measurement an important weather
forecasting tool. High barometric pressures generally are associated with fair weather, while low pressures are associated with
poor weather. Thus, rising barometric pressures indicate improving weather conditions, while falling pressures indicate
deteriorating weather conditions.
Dew Point - Dew point is the temperature to which air must be cooled in order for it to reach saturation (defined as 100% relative
humidity), providing there is no change in water vapor content. Dew point is an important measurement used to predict the
formation of dew, frost, and fog. If dew point and temperature are close together in the late afternoon when the air begins to turn
colder, fog is likely during the night. Dew point is also a good indicator of the air's actual water vapor content, unlike relative
humidity, which takes the air's temperature into account. High dew point indicates high water vapor content; low dew point
indicates low water vapor content. Additionally, a high dew point indicates a better chance of rain, severe thunderstorms, and/or
tornados. You can also use dew point to predict the minimum overnight temperature. Provided no new fronts are expected
overnight and the afternoon relative humidity is greater than or equal to 50%, the afternoon's dew point gives you an idea of what
minimum temperature to expect overnight, since the air can never get colder than the dew point. Dew Point also helps predict low
cloud levels. High dew point signifies moist air. An approximate cloud base calculation allows 400ft for every 1 degree difference
between temperature and dew point.
ET - Evapotranspiration - Evapotranspiration (ET) is the amount of water that moves from the ground (and plants on the ground)
to the atmosphere through both evaporation and transpiration. It is primarily important to people who are monitoring plant
growth and associated water usage. Measuring actual ET for a given location requires the measurement of weather variables at
different heights at the same location and is beyond the capabilities of the current Davis weather stations. Instead, a single set of
weather data measurements are used to calculate a Reference ET (ETo). ETo is the amount of ET that is expected at a location with
specified reference conditions under the actual weather conditions. The two most common reference conditions used for
agricultural purposes are the grass reference (ETo) which consists of an extensive surface of well-watered grass that completely
shades the ground and is uniformly clipped to a few inches in height, or the alfalfa reference (ETr) similar to the grass reference
but using alfalfa instead of grass, and at different height. The Davis ET calculations all calculate ETo from a grass reference.
The Texas A&M Irrigation Technology Program describes Evapotranspiration (ET) as follows: "Evapotranspiration (ET) is a
measurement of the total amount of water needed to grow plants and crops. This term comes from the words evaporation (i.e.,
evaporation of water from the soil) and transpiration (i.e., transpiration of water by plants). Different plants have different water
requirements, so they have different ET rates.
Since there are thousands of cultivated plants, we have tried to simplify matters by establishing a standard ET rate for general
reference and use. The standard is referred to as the potential evapotranspiration ETo (pet). This is the potential ET since we are
assuming the crop is in a deep soil and under well watered conditions. The standard crop we are using is a cool season grass
which is 4-inches tall. The technical term for this is the "Potential Evapotranspiration of a Grass Reference Crop" or "ETo" for short.
ETo depends on the climate and varies from location to location. Special weather stations are used to collect the climatic data for
calculating ETo,including temperature, dew point temperature (relative humidity), wind speed, and solar radiation.
The water requirements of specific crops and turf grasses can be calculated as a fraction of the ETo. This "fraction" is the called the
crop coefficient (Kc) or turf coefficient (Tc). Crop coefficients vary depending on the type of plant and its stage of growth.
We are using the standardized Penman-Monteith method to calculate ETo from the weather station data. This is one of a number
of methods that can be used to determine ETo and ET. Several organizations, such as the International Committee on Irrigation
and Drainage and the Water Requirements Committee of the American Society of Civil Engineers, have proposed establishing the
Penman-Monteith method as a world-wide standard. Such a standard would help facilitate the sharing of ETo data and
development of crop coefficients."
Heat Index [NOAA.GOV] - About 237 Americans succumb to the taxing demands of heat every year. Our bodies dissipate heat by
varying the rate and depth of blood circulation, by losing water through the skin and sweat glands, and as a last resort, by panting,
when blood is heated above 98.6 ºF. Sweating cools the body through evaporation. However, high relative humidity retards
evaporation, robbing the body of its ability to cool itself.
When heat gain exceeds the level the body can remove, body temperature begins to rise, and heat related illnesses and disorders
may develop.
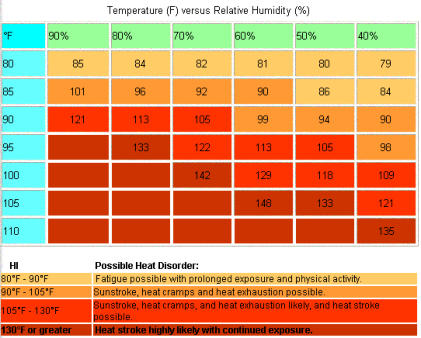
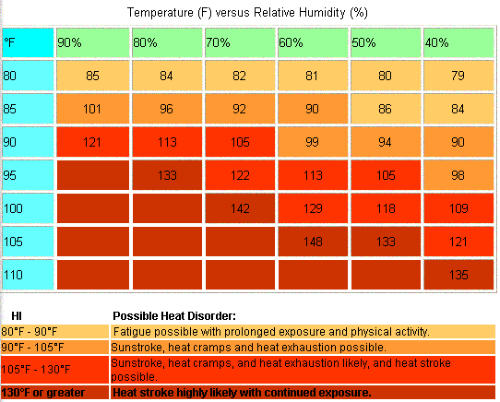
The Heat Index (HI) is the temperature the body feels when heat and humidity are combined. The chart below shows the HI that
corresponds to the actual air temperature and relative humidity. (This chart is based upon shady, light wind conditions. Exposure
to direct sunlight can increase the HI by up to 15 ºF.
(Due to the nature of the heat index calculation, the values in the tables below have an error +/- 1.3 ºF.)
Heating/Cooling Degree Days - A "degree day" is a unit of measure for recording how hot or how cold it has been over a 24-hour
period. The number of degree days applied to any particular day of the week is determined by calculating the mean temperature
for the day and then comparing the mean temperature to a base value of 65 ºF. (The "mean" temperature is calculated by adding
together the high for the day and the low for the day, and then dividing the result by 2.)
If the mean temperature for the day is, say, 5 degrees higher than 65, then there have been 5 cooling degree days. On the other
hand, if the weather has been cool, and the mean temperature is, say, 55 degrees, then there have 10 heating degree days (65
minus 55 equals 10).
Why do we want or need to know the number of "degree days?" It is a good way to generally keep track of how much demand
there has been for energy needed for either heating or cooling buildings. The cooler the weather, the larger the number of
"heating degree days"... and the larger the number of heating degree days, the heavier the demand for energy needed to heat
buildings. Likewise, The warmer the weather, the larger the number of "cooling degree days"... and the larger the number of
cooling degree days, the heavier the demand for energy needed to cool buildings.
Where Can I Find the Actual Number of Degree Days Accumulated in Recent Months?"
Degree day calculations are made at the end of each day and sent out the following morning in a National Weather Service (NWS)
product called "Climate Report." Addressing our case here in Lakewood, CO, one would visit the NWS's web site at
"http://www.weather.gov/climate/index.php?wfo=bou" and select the "Monthly Weather Summary for Denver, CO...Most Recent.
You would then drop down on the presented "Climate Report" page to find the "DEGREE_DAYS" presentation. You would see for
the month of April, 2007 for example, we had a total of 544 Heating Degree Days, and a total of 5 Cooling Degree Days.
Humidity - The term "humidity" itself refers to the amount of water vapor in the air. However, the total amount of water vapor
that the air can hold varies with the air's temperature and pressure. Relative Humidity takes into account these factors and offers
a humidity reading which reflects the amount of water vapor in the air as a percentage of the amount the air is capable of holding.
Relative humidity is therefore not an actual direct measurement of the amount of water vapor in the air, but a calculated ratio of
the air's water vapor content to its capacity.
Knot - 1 knot = 1.1508 mph.
Solar Radiation - What we call "current solar radiation" is technically known as "Global Solar Radiation." This is a measure of the
intensity, the energy, of the sun's radiation reaching a horizontal surface. The irradiance includes both the direct component from
the sun and the reflected component from the rest of the sky. The solar radiation reading gives a measure of the amount of solar
radiation hitting the solar radiation sensor at any given time, expressed in Watts/Square Meter (W/M^2). If you observe the sunrise
and sunset times, you'll see that on a day with minimal clouds you will have solar radiation readings that begin with sunrise and
end at sunset.
Temperature - [Wikipedia] Temperature is a physical property of a system that underlies the common notions of hot and cold;
something that is hotter has the greater temperature. Temperature is one of the principal parameters of thermodynamics. The
temperature of a system is related to the average energy of microscopic motions in the system. For a solid, these microscopic
motions are principally the vibrations of the constituent atoms about their sites in the solid. For an ideal mon-atomic gas, the
microscopic motions are the translational motions of the constituent gas particles.
Temperature is measured with thermometers that may be calibrated to a variety of temperature scales. Throughout the world
(except for in the U.S.), the Celsius scale is used for most temperature measuring purposes. The entire scientific world (the U.S.
included) measures temperature using the Celsius scale, and thermodynamic temperature using the Kelvin scale. Many
engineering fields in the U.S., especially high-tech ones, also use the Kelvin and Celsius scales. The bulk of the U.S. however, (its lay
people, industry, meteorology, and government) relies upon the Fahrenheit scale. Other engineering fields in the U.S. also rely
upon the Rankine scale when working in thermodynamic-related disciplines such as combustion.
Intuitively, temperature is a measure of how hot or cold something is. Microscopically, temperature is the result of the motion of
particles which make up a substance. Temperature increases as the energy of this motion increases. The motion may be the
translational motion of the particle, or the internal energy of the particle due to molecular vibration or the excitation of an electron
energy level. Although very specialized laboratory equipment is required to directly detect the translational thermal motions,
thermal collisions by atoms or molecules with small particles suspended in a fluid produces Brownian motion that can be seen
with an ordinary microscope. The thermal motions of atoms are very fast and temperatures close to absolute zero are required to
directly observe them. For instance, when scientists at the NIST achieved a record-setting cold temperature of 700 nK (1 nK = 10−9
K) in 1994, they used optical lattice laser equipment to adiabatically cool cesium atoms. They then turned off the entrapment
lasers and directly measured atom velocities of 7 mm per second in order to calculate their temperature.
Molecules, such as O2, have more degrees of freedom than single atoms: they can have rotational and vibrational motions as well
as translational motion. An increase in temperature will cause the average translational energy to increase. It will also cause the
energy associated with vibrational and rotational modes to increase. Thus a diatomic gas, with extra degrees of freedom like
rotation and vibration, will require a higher energy input to change the temperature by a certain amount, i.e. it will have a higher
heat capacity than a mon-atomic gas.
The process of cooling involves removing energy from a system. When there is no more energy able to be removed, the system is
said to be at absolute zero, which is the point on the thermodynamic (absolute) temperature scale where all kinetic motion in the
particles comprising matter ceases and they are at complete rest in the ?classic? (non-quantum mechanical) sense. By definition,
absolute zero is a temperature of precisely 0 kelvin (−273.15 ºC or −459.67 ºF).
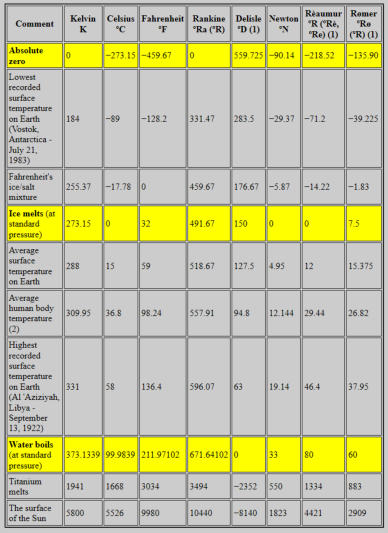
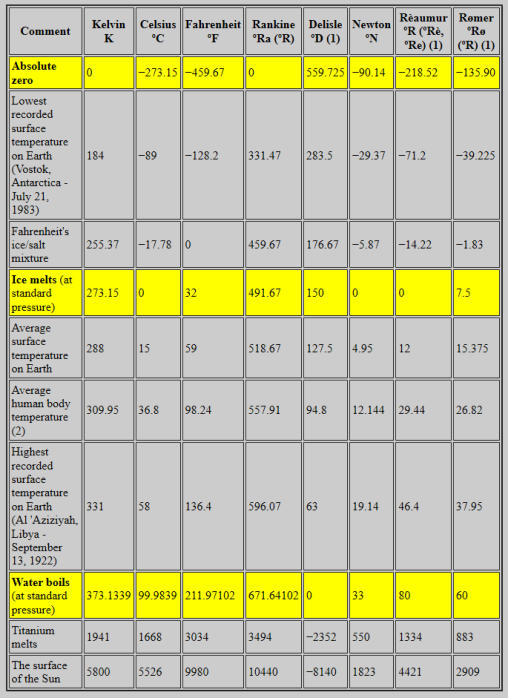
Comparison of Temperature Scales
(1) The temperature scale is in disuse, and of mere historical interest.
(2) Normal human body temperature is 36.8 ºC +/- 0.7 ºC, or 98.2 ºF +/- 1.3 ºF. The commonly given value 98.6 ºF is simply the exact
conversion of the nineteenth-century German standard of 37 ºC. Since it does not list an acceptable range, it could therefore be said to
have excess (invalid) precision. Some numbers in this table have been rounded off.
THW Index: The THW index combines air temperature, wind chill index, and heat index to produce a more accurate apparent
temperature. This is how the temperature will feel when you are out of the sun.
THSW Index: Same concept as for theTHW index, but THSW index includes the effects of the sun's solar energy and is the most
useful measure of how it would feel if you were standing directly in sunlight. Parameters Used: Temperature, Humidity, Solar
Radiation, Wind Speed, Latitude & Longitude, Time and Date. Like Heat Index, the THSW Index uses humidity and temperature to
calculate an apparent temperature. In addition, THSW incorporates the heating effects of solar radiation and the cooling effects of
wind (like wind chill) on our perception of temperature. The formula used to calculate THSW by our Vantage Pro 2 Plus system
was developed by Steadman (1979). The following describes the series of formulas used to determine the THSW or Temperature-
Humidity-Sun-Wind Index. Thus, this index indicates the level of thermal comfort including the effects of all these values. This
Index is calculated by adding a series of successive terms. Each term represents one of the three parameters: (Humidity, Sun &
Wind). The humidity term serves as the base from which increments for sun and wind effects are added.
HUMIDITY FACTOR: The first term is humidity. This term is determined in the same manner as the Heat Index. This term
serves as a base number to which increments of wind and sun are added to come up with the final THSW Index
temperature.
SUN FACTOR: The second term is sun. This term, Qg, is actually a combination of four terms (direct incoming solar, indirect
incoming solar, terrestrial, and sky radiation). The term depends upon wind speed to determine how strong an effect it is.
The value is limited to between −20 and +130 W/m2 in the Vantage Pro2 console firmware and WeatherLink software
versions 5.6 or later.
WIND FACTOR: The third term is wind. Depending upon the version of firmware or software, this term is determined in part
by a lookup table (for temperatures above 50 ºF)and in part by the wind chill calculation, or uses an integrated table that is
used both for calculation of this term and for wind chill. With this in mind, the following criterion apply with later versions
referring to Vantage Pro2 console firmware revision May 2005 or later or WeatherLink version5.6 or later:
- At 0 mph, this term is equal to zero.
- For temperatures at or above 68 ºF and wind speeds above 40 mph,the wind speed is set to40 mph. For later versions,
there is no upper limit on wind speed.
-For temperatures at or above 130 ºF, this term is set equal to zero. For later versions of this algorithm: WeatherLink uses
144 ºF as the threshold; Vantage Pro2console firmware143 ºF. This is based on a best-fit regression of the Steadman 1979
wind table. The differences are reflective of the higher resolution used in the WeatherLink software.
- For temperatures below 50 ºF (later versions use the new wind chill formula result here (calculate the wind chill increment
using the difference between the air temperature and wind chill)):
-- For the earlier display console versions and WeatherLink version5.0 or 5.1: use the wind chill calculation as the base
temperature.
--For the WeatherLink software (versions 5.2 through 5.5.1): use the new heat index formula (as described in the heat index
section) as the base temperature and calculate the wind chill increment using the difference between the air temperature
and wind chill (which is always a negative number). The resulting value is the wind term, which will be added to the humidity
term and subsequently the sun term as indicated below. Note: The WeatherLink software(version 5.2 through 5.5.1) offers a
variable does not include the sun term in its calculation. It shows the result as the "THW Index"or "Temperature-Humidity-
Wind Index." This value indicates the"apparent" temperature in the shade due to these factors.
REFERENCES
Steadman, R. G., 1979: The Assessment of Sultriness, Part II: Effects of Wind, Extra Radiation
and Barometric Pressure on Apparent Temperature. Journal of Applied Meteorology,
July 1979.
"Media Guide to NWS Products and Services", National Weather Service Forecast Office,
Monterey, CA, 1995.
Quayle, R. G. and Steadman, R. G., 1998: The Steadman Wind Chill: An Improvement over
Present Scales. Weather and Forecasting, December 1998.
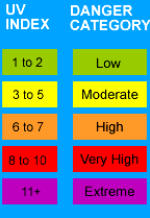
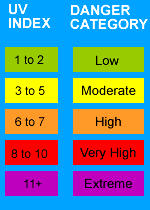
UV (Ultra-violet) Index - The UV Index is a measure of the amount of skin damaging UV radiation reaching
the earth's surface. The amount of UV radiation reaching the surface at any given time is primarily related
to the elevation of the sun in the sky, the amount of ozone in the stratosphere, and the amount of clouds
present. The UV Index can range from 0 (when it is nighttime) to 15 or 16 (in the tropics a thigh elevations
under clear skies). UV radiation is greatest when the sun is highest in the sky and rapidly decreases as the
sun approaches the horizon. The higher the UV Index, the greater the dose rate of skin damaging (and eye
damaging) UV radiation. Consequently, the higher the UV Index, the shorter the time before skin damage
occurs.
There are several effects experienced as a result of overexposure to UV radiation: 1) a severe sunburn
following an intense short term overexposure, and 2) the more serious skin cancers developing after long term overexposure.
Melanoma, the more deadly of the two types of skin cancer, occurs when the person has been subjected to several intense short
term overexposures. Non-melanoma skin cancers, which are almost 100% curable, occur in people who are overexposed for very
long periods of time, such as construction workers, farmers, or fishermen. Long term overexposure to UV radiation has been
linked to the formation of cataracts in the eyes as well.
The UV Index forecast indicates the probable intensity of skin damaging ultraviolet radiation reaching the surface during the solar
noon hour (11:30-12:30 local standard time or 12:30-13:30 local daylight time). The greater the UV Index is the greater the amount
of skin damaging UV radiation. How much UV radiation is needed to actually damage one's skin is dependent on several factors.
But in general the darker one's skin is, that is the more melanin one has in his/her skin, the longer (or the more UV radiation) it
takes to cause erythema (skin reddening).
Wind Speed - Wind Speed is the current sustained wind, while Wind Gust is the current intermittent burst of wind speed. Wind
speed is measured by the weather station's anemometer. The station calculates a 10-minute average wind speed and a dominant
10-minute wind direction as "wind speed."
Wind Gusts - Intermittent bursts of wind are generally considered to be "gusts" when the wind speed reaches 16 knots or
18.4mph (1 knot = 1.1508 mph) and the variability of the wind from highest point to lowest is more than 9 knots or 10.4 mph. A
gust will usually be defined as less than 20 seconds in duration and is the maximum speed reached by the wind. With personal
weather stations, the definition of Gust varies by manufacturer and software used. Some software packages do not send
information on wind gusts to online weather specialty sites such as Wunderground.com, so the "gust" reading you will see may be
the highest measured wind reading.
Wind run: Wind run is measurement of the "amount" of wind passing the station during a given period of time, expressed in
either "miles of wind" or "kilometers of wind". Wind run is calculated by multiplying the average wind speed for each archive
record by the archive interval.
For Example:
Average Wind Speed = 5 mph
Archive Interval = 30 minutes (0.5 hours)
Wind Run = 5 mph x 0.5 hours = 2.5 miles of wind
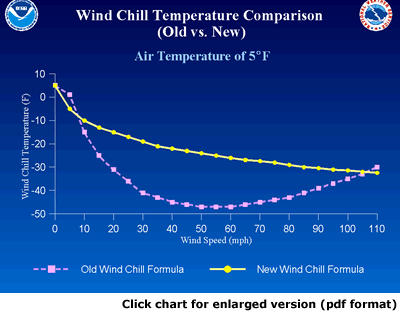
Wind Chill - Parameters Used: Outside Air Temperature and Wind Speed. Wind chill takes into account how the speed of the wind
affects our perception of the air temperature. Our bodies warm the surrounding air molecules by transferring heat from the skin.
If there's no air movement, this insulating layer of warm air molecules stays next to the body and offers some protection from
cooler air molecules. However, wind sweeps that comfy warm air surrounding the body away. The faster the wind blows, the faster
heat is carried away and the colder the environment feels. The new formula was adopted by both Environment Canada and the
U.S. National Weather Service to ensure a uniform wind chill standard in North America. The formula is supposed to more closely
emulate the response of the human body when exposed to conditions of wind and cold than the old formula did.
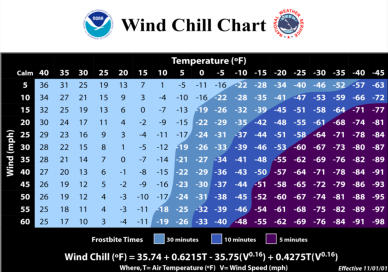
Formulas Implemented:
35.74 + 0.6215T - 35.75 * (V 0.16 ) + 0.4275T * (V 0.16 )
Any place where the result yields a wind chill temperature greater than the air temperature, the wind chill is set equal to the air
temperature. This always occurs at wind speeds of 0 mph or temperatures above 76 ºF. This also occurs at lower wind speeds with
temperatures between 0 ºF and 76 ºF. The new formula takes into account the fact that wind speeds are measured "officially" at 10
meters (33 feet) above the ground, but the human is typically only 5 to 6 feet (2 meters) above the ground. So, anemometers still
need to be mounted as high as possible (e.g., rooftop mast) to register comparable wind speed readings and wind chill values. Our
newer version of the formula addresses the fact that the latest National Weather Service (NWS) formula was not designed for use
above 40 ºF. The result of the straight NWS implementation was little or no chilling effect at mild temperatures. This updated
version provides for reasonable chilling effect at mild temperatures based on the effects determined by Steadman (1979) (see
THSW Index section), but as with the new NWS formula, no upper limit where chilling has no additional effect. This later version for
the console table only differs in that whole degrees and less resolution in the table are used for code and memory space
conservation. As with previous versions of the wind chill formula, any place where the result yields a wind chill temperature
greater than the air temperature, the wind chill is set equal to the air temperature. This always occurs at wind speeds of 0 mph or
temperatures at or above 93.2 ºF (34 ºC). This also occurs at lower wind speeds with temperatures between 0 ºF (-18 ºC) and 93.2
ºF (34 ºC). As per Steadman (1979), 93.2 ºF (34 ºC) is the average temperature of skin at mild temperatures, thus temperatures
above this value will actually create an apparent warming effect (see THSW Index section). The Vantage Pro and Vantage Pro2
console uses the "10-minute average wind speed" to determine wind chill, which is updated once per minute. When 10-minute of
wind speed data is unavailable, it uses a running average until 10-minutes worth of data is collected. The reason an average wind
speed is employed in the Vantage Pro and Vantage Pro2 to calculate wind chill is as follows: The human body has a high heat
capacity, thus high wind speeds have no effect on the body's thermal equilibrium. So, an average wind speed provides a more
accurate representation of the body's response than an instantaneous reading. Also, "official" weather reports (from which wind
chill is calculated) provide average wind speed, so using an average wind speed more closely matches the results that are seen in
weather reports.
REFERENCES
"Media Guide to NWS Products and Services", National Weather Service Forecast Office, Monterey, CA, 1995.
"New Wind Chill Temperature Index", Office of Climate, Water and Weather Services, Washington, DC, 2001.
Siple, P. and C. Passel, 1945. “Measurements of Dry Atmospheric Cooling in Subfreezing Temperatures.” Proc. Amer. Philos.
Soc. Steadman, R. G., 1979: T”he Assessment of Sultriness, Part I: A Temperature-Humidity Index Based on Human
Physiology and Clothing Science.” Journal of Applied Meteorology, July 1979
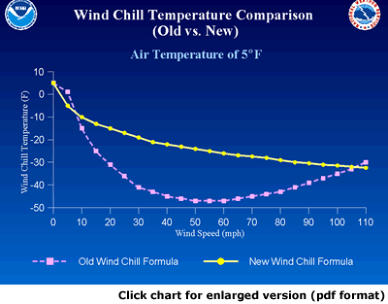
In 2001, NWS implemented an updated Wind Chill Temperature (WCT) index. The change improves upon the former WCT
Index used by the NWS and the Meteorological Services of Canada, which was based on the 1945 Siple and Passel Index.
**********
In the fall of 2000, the Office of the Federal Coordinator for Meteorological Services and Supporting Research (OFCM) formed a
group consisting of several Federal agencies, MSC, the academic community (Indiana University-Purdue University in Indianapolis
(IUPUI), University of Delaware and University of Missouri), and the International Society of Biometeorology to evaluate and
improve the windchill formula. The group, chaired by the NWS, is called the Joint Action Group for temperature Indices (JAG/TI).
JAG/TI's goal is to upgrade and standardize the index for temperature extremes internationally (e.g. Windchill Index).
The current formula uses advances in science, technology, and computer modeling to provide a more accurate, understandable,
and useful formula for calculating the dangers from winter winds and freezing temperatures.
(click on chart for a larger version)
Clinical trials were conducted at the Defense and Civil Institute of Environmental Medicine in Toronto, Canada, and the trial results
were used to improve the accuracy of the new formula and determine frostbite threshold values.
Standardization of the WCT Index among the meteorological community provides an accurate and consistent measure to ensure
public safety. The new wind chill formula is now being used in Canada and the United States.
Specifically, the new WCT index:
Calculates wind speed at an average height of five feet (typical height of an adult human face) based on readings from the
national standard height of 33 feet (typical height of an anemometer)
Is based on a human face model
Incorporates modern heat transfer theory (heat loss from the body to its surroundings, during cold and breezy/windy days)
Lowers the calm wind threshold to 3 mph
Uses a consistent standard for skin tissue resistance
Assumes no impact from the sun (i.e., clear night sky)
Note: Wind Chill Temperature is only defined for temperatures at or below 50 ºF and wind speeds above 3 mph. Bright sunshine
may increase the wind chill temperature by 10 to 18 ºF.
To view the NWS brochure about the new wind chill temperature index, click here.
For more information visit: https://www.weather.gov/safety/cold
More Definitions
Want to see the equation from which HI is derived? Click HERE


NWS Weather Conditions
Station Measurement Definitions & Calculations
(Updated 12 December 2020)

NWS WEATHER CONDITIONS
Blizzard
(BLZD):
Sustained
wind
or
frequent
gusts
of
35
mph
or
greater;
and
considerable
falling
and/or
blowing
snow
(i.e.,
reducing
visibility
frequently
to
less
than
1/4
mile.
These
conditions
must
persist
for
3
hours
or
longer
in
order for the storm to be classified as a blizzard.
Blowing
Snow
Advisory:
Issued
when
wind
driven
snow
reduces
surface
visibility,
possibly
hampering
travel.
Blowing
snow
may
be
falling
snow,
or
snow
that
has
already
accumulated
but
is
picked
up
and
blown
by
strong
winds.
This
advisory
was
discontinued
beginning
with
the
2008-2009
winter
storm
season,
replaced
by
the
"Winter
Weather Advisory for Snow and Blowing Snow."
Heavy
Snow:
Snowfall
accumulating
to
4"
or
more
in
depth
in
12
hours
or
less;
or,
snowfall
accumulating
6
inches
or
more in depth in 24 hours or less.
Heavy
Snow
Warning:
May
be
issued
instead
of
a
Winter
Storm
Warning
when
heavy
snow
is
the
only
significant
winter
weather
expected.
Issued
by
the
National
Weather
Service
when
snowfall
of
6"
or
more
in
12
hours
or
8"
or
more
in
24
hours
is
either
imminent
or
occurring.
These
criteria
are
specific
for
the
Midwest
and
may
vary
regionally.
High
Wind
Advisory:
Issued
by
the
National
Weather
Service
when
high
wind
speeds
may
pose
a
hazard.
The
criteria
varies
from
state
to
state.
In
Michigan,
for
example,
the
criteria
is
sustained
non-convective
(not
related
to
thunderstorms)
winds
greater
than
or
equal
to
30
mph
lasting
for
one
hour
or
longer,
or
winds
greater
than
or
equal to 45 mph for any duration.
High
Wind
Warning:
Issued
by
the
National
Weather
Service
when
high
wind
speeds
may
pose
a
hazard
or
is
life
threatening.
Criteria
varies
from
state
to
state.
In
Michigan,
for
example,
the
criteria
is
sustained
non-convective
(not
related
to
thunderstorms)
winds
greater
than
or
equal
to
40
mph
lasting
for
one
hour
or
longer,
or
winds
greater
than or equal to 58 mph for any duration.
Ice
Storm
Warning:
May
be
issued
instead
of
a
Winter
Storm
Warning
when
significant
ice
accumulation
is
the
only
significant
winter
weather
expected.
Issued
by
the
National
Weather
Service
when
freezing
rain
produces
a
significant
and
possibly
damaging
accumulation
of
ice.
The
criteria
for
this
warning
varies
from
state
to
state,
but
typically
will
be
issued
any
time
more
than
1/4"
of
ice
is
expected to accumulate in an area.
Wind
Chill
Advisory:
The
National
Weather
Service
issues
this
product
when
the
wind
chill
could
be
life
threatening
if
action
is
not
taken.
Criteria
varies
from
state
to
state.
Had
been
known
to
be
issued
when
wind
chills
of
-15
to
-24
degrees are expected.
Wind
Chill
Warning:
Issued
when
the
wind
chill
is
life
threatening.
Varies
from
state
to
state.
For
example,
had
been
Issued
when
wind
chills
of
-25
degrees
or
below
are
expected.
Winter
Storm
Warning:
Issued
by
the
National
Weather
Service
when
a
winter
storm
is
producing
or
is
forecast
to
produce
heavy
snow
or
significant
ice
accumulations.
The
criteria
for
this
warning
can
vary
from
place
to
place,
and
can
include
expected
conditions
such
as
a
combination
of
heavy
snow,
freezing
rain,
sleet,
blowing
&
drifting
snow
or
excessive wind chill.
Winter
Storm
Watch:
Issued
to
inform
the
public
of
the
possibility
that
one
or
more
of
the
following
events
may
occur.
Product
is
issued
b
the
National
Weather
Service
when
there
is
a
potential
for
heavy
snow
or
significant
accumulations,
usually
at
least
24-36
hours
in
advance.
The
criteria
for
this
watch
can
vary
from
place
to
place,
but
generally includes the following possibilities:
•
Blizzard conditions
•
Heavy snow
•
Excessive wind chill
•
Significant accumulations of ice or sleet.
A
Winter
Storm
Watch
is
usually
issued
24-36
hours
in
advance of the possible event.
Winter
Weather
Advisory:
A
Winter
Weather
Advisory
is
issued
by
the
National
Weather
Service
of
the
United
States
when
a
low
pressure
system
produces
a
combination
of
winter
weather
that
presents
a
hazard,
but
does
not
meet
warning
criteria.
A
Winter
Weather
Advisory
is
similar
to
significant
weather
advisory,
but
a
winter
weather
advisory
is
an
official
product.
A
similar
warning
is
issued
by
Environment
Canada's
Meteorological
Service
of
Canada
offices.
Winter
Weather
Advisory
for
Snow
and
Blowing
Snow:
Issued
when
wind
driven
snow
reduces
surface
visibility,
possibly
hampering
travel.
Blowing
snow
may
be
falling
snow,
or
snow
that
has
already
accumulated
but
is
picked
up
and
blown
by
strong
winds.
This
advisory
was
implemented
beginning
with
the
2008-2009
winter
storm
season, replacing the "Blowing Snow Advisory."
STATION MEASUREMENTS/CALCULATIONS
Atmospheric
Pressure
-
The
weight
of
the
air
making
up
our
atmosphere
exerts
a
pressure
on
the
surface
of
the
earth.
This
pressure
is
known
as
"Atmospheric"
pressure.
Generally,
the
more
air
above
an
area,
the
higher
the
atmospheric
pressure.
The
amount
of
atmospheric
pressure
is
therefore
different
at
different
altitudes.
Atmospheric
pressure
is
less
on
a
mountain
top
than
it
is
at
sea
level.
The
atmospheric
pressure
as
measured
at
sea
level
is
assigned
the
standard
value
of
one
(1)
atmosphere,
and
is
equal
to
14.6959488
pounds
per
square
inch.
One
standard
used
to
ascertain
the
atmospheric
pressure
is
a
device
known
as
a
mercury
barometer.
A
mercury
barometer
has
a
glass
column,
or
tube,
that's
on
average
30
inches
in
height.
It
is
closed
or
sealed
at
the
top,
but
open
at
the
bottom
where
it
is
part
of
a
mercury
filled
reservoir.
The
mercury
in
the
tube
adjusts
its
level
until
the
weight
of
the
mercury
is
equal
to
the
atmospheric
force
applied
to
the
mercury
in
the
reservoir.
Atmospheric
pressure
is
not
a
constant
at
any
fixed
location,
but
will
vary
with
changing
weather
conditions.
As
the
weight
of
the
atmosphere
changes
due
to
weather,
the
level
of
the
mercury
in
the
tube
would
then
also
vary
accordingly.
High
pressure
conditions
force
more
mercury
into
the
tube,
while
lower
pressures
result
in
less
mercury
in
the
tube.
The
height
of
the
mercury
in
the
tube
is
measured
in
inches.
A
standard
atmosphere
of
1,
or
14.69
lbs
per
square
inch,
will
raise
the
level
of
the
mercury
to
a
height
of
29.92
inches
at
sea
level.
Thus,
we
have
the
standard
measurement
on
what
we
would
call
a
standard
(dry)
day
of
29.92"
of
Mercury,
or
29.92"
Hg,
of
atmospheric
pressure, which equates to 14.6959488 lbs/in
2
.
The
United
States
and
Britain
still
use
these
older
measurement
units.
In
1960
the
International
System
of
Units,
SI,
was
developed.
This
system
of
units
is
based
upon
the
metric
meter/kilogram/second
(mks)
system,
which Britain and the USA are both slow to embrace.
Pressure
as
measured
in
the
SI
"mks"
system
is
defined
in
terms
of
the
Pascal,
and
equals
a
force
of
one
Newton
per
square
meter
(in
turn,
a
Newton
is
the
force
required
to
give
a
1
kilogram
mass
an
acceleration
of
1
meter
per
second
per
second.)
The
Pascal
is
a
very
small
amount
of
pressure,
so
we
often
use
KiloPascals
(kPa),
equal
to
one
thousand
Pascals.
Using
the
SI
system
of
units,
one
atmosphere is equal to 101.325 kPa, or 101,325 Pa.
The
sciences
(meteorology)
involving
weather
have
adopted
the
"bar"
as
the
unit
of
pressure
measurement
in
addition
to
the
old,
standard
"English"
units.
A
"bar"
is
equal
to
1x10^5
Pascal.
This
pressure
is
most
often
expressed
in
terms
of
millibars
of
pressure
to
avoid
using
a
lot
of
decimal
points.
A
pressure
of
1
atmosphere
is
equal
to
1000
millibars
or
1
bar.
If
you
run
the
math,
you'll
see
then
that
a
standard
atmospheric
pressure,
as
defined
using
English
units
of
measurement
of
29.92"
of
Hg,
or
14.69
pounds
per
square
inch,
is
equal
to
1
bar
or
1,000
millibars under the SI system.
Barometric
Pressure
-
Atmospheric
pressure
varies
with
both
altitude
and
weather
changes.
At
sea
level,
given
a
standard
day
(implies
dry
air),
we
will
measure
an
atmospheric
pressure
of
29.92"
of
Mercury
(29.92"
Hg),
or
1
bar
(1000mb).
At
that
very
same
moment
in
time,
if
you
measure
the
atmospheric
pressure
at
an
altitude
of
5,000
feet
(Denver,
etc.),
you
will
measure
an
atmospheric
pressure
of
only
24.89"
Hg
(or
only
12.23
pounds
square
inch).
The
pressure
in
SI
units
at
5,500
feet
is
827
millibars.
To
work
from
a
common
reference
point,
Meteorologists
are
interested
in
measuring
the
changes
in
atmospheric
pressure
due
only
to
the
effects
of
weather
phenomenon
and
must
therefore
somehow
discount
pressure
values
effected
by
differences
in
altitude.
To
normalize
the
effects
of
altitude
on
atmospheric
pressure,
i.e.,
to
compensate
for
differences
in
pressure
readings
associated
with
different
altitudes
at
different
locations,
atmospheric
pressure
is
converted
to
an
equivalent
pressure
referenced
to
sea
level.
This
referenced
measurement
has
been
assigned
the
name
"Barometric"
pressure.
Our
station
actually
measures
atmospheric
pressure
then
converts
this
value
to
barometric
pressure
based
upon
our
altitude
(5445
feet).
Atmospheric
pressure,
and
subsequently
Barometric
pressure
as
well,
is
in
America
generally
measured
in
units
of
Mercury.
We
use
the
standard
of
1
atmosphere
being
able
to
push
a
column
of
mercury
up
a
tube
to
a
level
of
29.9246899
inches
of
mercury.
Therefore,
when
the
barometric
pressure
of
one
atmosphere
at
sea
level
is
measured
to
be
29.92"
of
Hg,
then
our
station
at
our
altitude
will
report
an
equivalent
of
that
value
(one
atmosphere),
i.e.,
29.92"
of
Hg
in
spite
of
our
altitude,
given
all
other
parameters
remain
constant.
Now,
we
can
follow
barometric
pressure
changes
with
local
weather
conditions,
making
this
measurement
an
important
weather
forecasting
tool.
High
barometric
pressures
generally
are
associated
with
fair
weather,
while
low
pressures
are
associated
with
poor
weather.
Thus,
rising
barometric
pressures
indicate
improving
weather
conditions,
while
falling
pressures
indicate
deteriorating
weather conditions.
Dew
Point
-
Dew
point
is
the
temperature
to
which
air
must
be
cooled
in
order
for
it
to
reach
saturation
(defined
as
100%
relative
humidity),
providing
there
is
no
change
in
water
vapor
content.
Dew
point
is
an
important
measurement
used
to
predict
the
formation
of
dew,
frost,
and
fog.
If
dew
point
and
temperature
are
close
together
in
the
late
afternoon
when
the
air
begins
to
turn
colder,
fog
is
likely
during
the
night.
Dew
point
is
also
a
good
indicator
of
the
air's
actual
water
vapor
content,
unlike
relative
humidity,
which
takes
the
air's
temperature
into
account.
High
dew
point
indicates
high
water
vapor
content;
low
dew
point
indicates
low
water
vapor
content.
Additionally,
a
high
dew
point
indicates
a
better
chance
of
rain,
severe
thunderstorms,
and/or
tornados.
You
can
also
use
dew
point
to
predict
the
minimum
overnight
temperature.
Provided
no
new
fronts
are
expected
overnight
and
the
afternoon
relative
humidity
is
greater
than
or
equal
to
50%,
the
afternoon's
dew
point
gives
you
an
idea
of
what
minimum
temperature
to
expect
overnight,
since
the
air
can
never
get
colder
than
the
dew
point.
Dew
Point
also
helps
predict
low
cloud
levels.
High
dew
point
signifies
moist
air.
An
approximate
cloud
base
calculation
allows
400ft
for
every
1
degree
difference
between
temperature
and dew point.
ET
-
Evapotranspiration
-
Evapotranspiration
(ET)
is
the
amount
of
water
that
moves
from
the
ground
(and
plants
on
the
ground)
to
the
atmosphere
through
both
evaporation
and
transpiration.
It
is
primarily
important
to
people
who
are
monitoring
plant
growth
and
associated
water
usage.
Measuring
actual
ET
for
a
given
location
requires
the
measurement
of
weather
variables
at
different
heights
at
the
same
location
and
is
beyond
the
capabilities
of
the
current
Davis
weather
stations.
Instead,
a
single
set
of
weather
data
measurements
are
used
to
calculate
a
Reference
ET
(ETo).
ETo
is
the
amount
of
ET
that
is
expected
at
a
location
with
specified
reference
conditions
under
the
actual
weather
conditions.
The
two
most
common
reference
conditions
used
for
agricultural
purposes
are
the
grass
reference
(ETo)
which
consists
of
an
extensive
surface
of
well-watered
grass
that
completely
shades
the
ground
and
is
uniformly
clipped
to
a
few
inches
in
height,
or
the
alfalfa
reference
(ETr)
similar
to
the
grass
reference
but
using
alfalfa
instead
of
grass,
and
at
different
height.
The
Davis
ET
calculations
all
calculate
ETo
from
a
grass reference.
The
Texas
A&M
Irrigation
Technology
Program
describes
Evapotranspiration
(ET)
as
follows:
"Evapotranspiration
(ET)
is
a
measurement
of
the
total
amount
of
water
needed
to
grow
plants
and
crops.
This
term
comes
from
the
words
evaporation
(i.e.,
evaporation
of
water
from
the
soil)
and
transpiration
(i.e.,
transpiration
of
water
by
plants).
Different
plants
have
different
water
requirements,
so
they
have different ET rates.
Since
there
are
thousands
of
cultivated
plants,
we
have
tried
to
simplify
matters
by
establishing
a
standard
ET
rate
for
general
reference
and
use.
The
standard
is
referred
to
as
the
potential
evapotranspiration
ETo
(pet).
This
is
the
potential
ET
since
we
are
assuming
the
crop
is
in
a
deep
soil
and
under
well
watered
conditions.
The
standard
crop
we
are
using
is
a
cool
season
grass
which
is
4-inches
tall.
The
technical
term
for
this
is
the
"Potential
Evapotranspiration
of
a
Grass
Reference
Crop"
or
"ETo"
for
short.
ETo
depends
on
the
climate
and
varies
from
location
to
location.
Special
weather
stations
are
used
to
collect
the
climatic
data
for
calculating
ETo,including
temperature,
dew
point
temperature
(relative
humidity),
wind
speed,
and
solar radiation.
The
water
requirements
of
specific
crops
and
turf
grasses
can
be
calculated
as
a
fraction
of
the
ETo.
This
"fraction"
is
the
called
the
crop
coefficient
(Kc)
or
turf
coefficient
(Tc).
Crop
coefficients
vary
depending
on
the
type
of
plant
and
its stage of growth.
We
are
using
the
standardized
Penman-Monteith
method
to
calculate
ETo
from
the
weather
station
data.
This
is
one
of
a
number
of
methods
that
can
be
used
to
determine
ETo
and
ET.
Several
organizations,
such
as
the
International
Committee
on
Irrigation
and
Drainage
and
the
Water
Requirements
Committee
of
the
American
Society
of
Civil
Engineers,
have
proposed
establishing
the
Penman-
Monteith
method
as
a
world-wide
standard.
Such
a
standard
would
help
facilitate
the
sharing
of
ETo
data
and
development of crop coefficients."
Heat
Index
[NOAA.GOV]
-
About
237
Americans
succumb
to
the
taxing
demands
of
heat
every
year.
Our
bodies
dissipate
heat
by
varying
the
rate
and
depth
of
blood
circulation,
by
losing
water
through
the
skin
and
sweat
glands,
and
as
a
last
resort,
by
panting,
when
blood
is
heated
above
98.6
ºF.
Sweating
cools
the
body
through
evaporation.
However,
high
relative
humidity
retards
evaporation, robbing the body of its ability to cool itself.
When
heat
gain
exceeds
the
level
the
body
can
remove,
body
temperature
begins
to
rise,
and
heat
related
illnesses
and disorders may develop.
The
Heat
Index
(HI)
is
the
temperature
the
body
feels
when
heat
and
humidity
are
combined.
The
chart
below
shows
the
HI
that
corresponds
to
the
actual
air
temperature
and
relative
humidity.
(This
chart
is
based
upon
shady,
light
wind
conditions.
Exposure
to
direct
sunlight
can
increase the HI by up to 15 ºF.
(Due to the nature of the heat index calculation, the values in the
tables below have an error +/- 1.3 ºF.)
Want to see the equation from which HI is derived? Click
HERE
Heating/Cooling
Degree
Days
-
A
"degree
day"
is
a
unit
of
measure
for
recording
how
hot
or
how
cold
it
has
been
over
a
24-hour
period.
The
number
of
degree
days
applied
to
any
particular
day
of
the
week
is
determined
by
calculating
the
mean
temperature
for
the
day
and
then
comparing
the
mean
temperature
to
a
base
value
of
65
ºF.
(The
"mean"
temperature
is
calculated
by
adding
together
the
high
for
the
day
and
the
low
for
the
day,
and
then
dividing the result by 2.)
If
the
mean
temperature
for
the
day
is,
say,
5
degrees
higher
than
65,
then
there
have
been
5
cooling
degree
days.
On
the
other
hand,
if
the
weather
has
been
cool,
and
the
mean
temperature
is,
say,
55
degrees,
then
there
have
10 heating degree days (65 minus 55 equals 10).
Why
do
we
want
or
need
to
know
the
number
of
"degree
days?"
It
is
a
good
way
to
generally
keep
track
of
how
much
demand
there
has
been
for
energy
needed
for
either
heating
or
cooling
buildings.
The
cooler
the
weather,
the
larger
the
number
of
"heating
degree
days"...
and
the
larger
the
number
of
heating
degree
days,
the
heavier
the
demand
for
energy
needed
to
heat
buildings.
Likewise,
The
warmer
the
weather,
the
larger
the
number
of
"cooling
degree
days"...
and
the
larger
the
number
of
cooling
degree
days,
the
heavier
the
demand
for
energy
needed
to
cool buildings.
Where
Can
I
Find
the
Actual
Number
of
Degree
Days
Accumulated in Recent Months?"
Degree
day
calculations
are
made
at
the
end
of
each
day
and
sent
out
the
following
morning
in
a
National
Weather
Service
(NWS)
product
called
"Climate
Report."
Addressing
our
case
here
in
Lakewood,
CO,
one
would
visit
the
NWS's
web site at
http://www.weather.gov/climate/index.php?wfo=bou
and
select
the
"Monthly
Weather
Summary
for
Denver,
CO...Most
Recent.
You
would
then
drop
down
on
the
presented
"Climate
Report"
page
to
find
the
"DEGREE_DAYS"
presentation.
You
would
see
for
the
month
of
April,
2007
for
example,
we
had
a
total
of
544
Heating Degree Days, and a total of 5 Cooling Degree Days.
Humidity
-
The
term
"humidity"
itself
refers
to
the
amount
of
water
vapor
in
the
air.
However,
the
total
amount
of
water
vapor
that
the
air
can
hold
varies
with
the
air's
temperature
and
pressure.
Relative
Humidity
takes
into
account
these
factors
and
offers
a
humidity
reading
which
reflects
the
amount
of
water
vapor
in
the
air
as
a
percentage
of
the
amount
the
air
is
capable
of
holding.
Relative
humidity
is
therefore
not
an
actual
direct
measurement
of
the
amount
of
water
vapor
in
the
air,
but
a
calculated
ratio
of
the
air's
water
vapor
content
to
its
capacity.
Knot - 1 knot = 1.1508 mph.
Solar
Radiation
-
What
we
call
"current
solar
radiation"
is
technically
known
as
"Global
Solar
Radiation."
This
is
a
measure
of
the
intensity,
the
energy,
of
the
sun's
radiation
reaching
a
horizontal
surface.
The
irradiance
includes
both
the
direct
component
from
the
sun
and
the
reflected
component
from
the
rest
of
the
sky.
The
solar
radiation
reading
gives
a
measure
of
the
amount
of
solar
radiation
hitting
the
solar
radiation
sensor
at
any
given
time,
expressed
in
Watts/Square
Meter
(W/M^2).
If
you
observe
the
sunrise
and
sunset
times,
you'll
see
that
on
a
day
with
minimal
clouds
you
will
have
solar
radiation
readings
that
begin with sunrise and end at sunset.
Temperature
-
[Wikipedia]
Temperature
is
a
physical
property
of
a
system
that
underlies
the
common
notions
of
hot
and
cold;
something
that
is
hotter
has
the
greater
temperature.
Temperature
is
one
of
the
principal
parameters
of
thermodynamics.
The
temperature
of
a
system
is
related
to
the
average
energy
of
microscopic
motions
in
the
system.
For
a
solid,
these
microscopic
motions
are
principally
the
vibrations
of
the
constituent
atoms
about
their
sites
in
the
solid.
For
an
ideal
mon-
atomic
gas,
the
microscopic
motions
are
the
translational
motions of the constituent gas particles.
Temperature
is
measured
with
thermometers
that
may
be
calibrated
to
a
variety
of
temperature
scales.
Throughout
the
world
(except
for
in
the
U.S.),
the
Celsius
scale
is
used
for
most
temperature
measuring
purposes.
The
entire
scientific
world
(the
U.S.
included)
measures
temperature
using
the
Celsius
scale,
and
thermodynamic
temperature
using
the
Kelvin
scale.
Many
engineering
fields
in
the
U.S.,
especially
high-tech
ones,
also
use
the
Kelvin
and
Celsius
scales.
The
bulk
of
the
U.S.
however,
(its
lay
people,
industry,
meteorology,
and
government)
relies
upon
the
Fahrenheit
scale.
Other
engineering
fields
in
the
U.S.
also
rely
upon
the
Rankine
scale
when
working
in
thermodynamic-related disciplines such as combustion.
Intuitively,
temperature
is
a
measure
of
how
hot
or
cold
something
is.
Microscopically,
temperature
is
the
result
of
the
motion
of
particles
which
make
up
a
substance.
Temperature
increases
as
the
energy
of
this
motion
increases.
The
motion
may
be
the
translational
motion
of
the
particle,
or
the
internal
energy
of
the
particle
due
to
molecular
vibration
or
the
excitation
of
an
electron
energy
level.
Although
very
specialized
laboratory
equipment
is
required
to
directly
detect
the
translational
thermal
motions,
thermal
collisions
by
atoms
or
molecules
with
small
particles
suspended
in
a
fluid
produces
Brownian
motion
that
can
be
seen
with
an
ordinary
microscope.
The
thermal
motions
of
atoms
are
very
fast
and
temperatures
close
to
absolute
zero
are
required
to
directly
observe
them.
For
instance,
when
scientists
at
the
NIST
achieved
a
record-setting
cold
temperature
of
700
nK
(1
nK
=
10−9
K)
in
1994,
they
used
optical
lattice
laser
equipment
to
adiabatically
cool
cesium
atoms.
They
then
turned
off
the
entrapment
lasers
and
directly
measured
atom
velocities
of
7
mm
per
second
in
order
to
calculate
their
temperature.
Molecules,
such
as
O2,
have
more
degrees
of
freedom
than
single
atoms:
they
can
have
rotational
and
vibrational
motions
as
well
as
translational
motion.
An
increase
in
temperature
will
cause
the
average
translational
energy
to
increase.
It
will
also
cause
the
energy
associated
with
vibrational
and
rotational
modes
to
increase.
Thus
a
diatomic
gas,
with
extra
degrees
of
freedom
like
rotation
and
vibration,
will
require
a
higher
energy
input
to
change
the
temperature
by
a
certain
amount,
i.e.
it
will
have
a
higher heat capacity than a mon-atomic gas.
The
process
of
cooling
involves
removing
energy
from
a
system.
When
there
is
no
more
energy
able
to
be
removed,
the
system
is
said
to
be
at
absolute
zero,
which
is
the
point
on
the
thermodynamic
(absolute)
temperature
scale
where
all
kinetic
motion
in
the
particles
comprising
matter
ceases
and
they
are
at
complete
rest
in
the
?classic?
(non-quantum
mechanical)
sense.
By
definition,
absolute
zero
is
a
temperature
of
precisely
0
kelvin
(−273.15
ºC
or
−459.67
ºF).
Comparison of Temperature Scales
(1) The temperature scale is in disuse, and of mere historical interest.
(2)
Normal
human
body
temperature
is
36.8
ºC
+/-
0.7
ºC,
or
98.2
ºF
+/-
1.3
ºF.
The
commonly
given
value
98.6
ºF
is
simply
the
exact
conversion
of
the
nineteenth-century
German
standard
of
37
ºC.
Since
it
does
not
list
an
acceptable
range,
it
could
therefore
be
said
to
have
excess
(invalid)
precision.
Some
numbers
in
this
table
have
been rounded off.
THW
Index:
The
THW
index
combines
air
temperature,
wind
chill
index,
and
heat
index
to
produce
a
more
accurate
apparent
temperature.
This
is
how
the
temperature will feel when you are out of the sun.
THSW
Index:
Same
concept
as
for
the
THW
index,
but
THSW
index
includes
the
effects
of
the
sun's
solar
energy
and
is
the
most
useful
measure
of
how
it
would
feel
if
you
were
standing
directly
in
sunlight.
Parameters
Used:
Temperature,
Humidity,
Solar
Radiation,
Wind
Speed,
Latitude
&
Longitude,
Time
and
Date.
Like
Heat
Index,
the
THSW
Index
uses
humidity
and
temperature
to
calculate
an
apparent
temperature.
In
addition,
THSW
incorporates
the
heating
effects
of
solar
radiation
and
the
cooling
effects
of
wind
(like
wind
chill)
on
our
perception
of
temperature.
The
formula
used
to
calculate
THSW
by
our
Vantage
Pro
2
Plus
system
was
developed
by
Steadman
(1979).
The
following
describes
the
series
of
formulas
used
to
determine
the
THSW
or
Temperature-Humidity-Sun-Wind
Index.
Thus,
this
index
indicates
the
level
of
thermal
comfort
including
the
effects
of
all
these
values.
This
Index
is
calculated
by
adding
a
series
of
successive
terms.
Each
term
represents
one
of
the
three
parameters:
(Humidity,
Sun
&
Wind).
The
humidity
term
serves
as
the
base
from
which
increments
for sun and wind effects are added.
HUMIDITY
FACTOR:
The
first
term
is
humidity.
This
term
is
determined
in
the
same
manner
as
the
Heat
Index.
This
term
serves
as
a
base
number
to
which
increments
of
wind
and
sun
are
added
to
come
up
with the final THSW Index temperature.
SUN
FACTOR:
The
second
term
is
sun.
This
term,
Qg,
is
actually
a
combination
of
four
terms
(direct
incoming
solar,
indirect
incoming
solar,
terrestrial,
and
sky
radiation).
The
term
depends
upon
wind
speed
to
determine
how
strong
an
effect
it
is.
The
value
is
limited
to
between
−20
and
+130
W/m2
in
the
Vantage
Pro2
console
firmware
and
WeatherLink
software versions 5.6 or later.
WIND
FACTOR:
The
third
term
is
wind.
Depending
upon
the
version
of
firmware
or
software,
this
term
is
determined
in
part
by
a
lookup
table
(for
temperatures
above
50
ºF)and
in
part
by
the
wind
chill
calculation,
or
uses
an
integrated
table
that
is
used
both
for
calculation
of
this
term
and
for
wind
chill.
With
this
in
mind,
the
following
criterion
apply
with
later
versions
referring
to
Vantage
Pro2
console
firmware
revision
May
2005
or
later
or
WeatherLink
version5.6 or later:
- At 0 mph, this term is equal to zero.
-
For
temperatures
at
or
above
68
ºF
and
wind
speeds
above
40
mph,the
wind
speed
is
set
to40
mph.
For
later versions, there is no upper limit on wind speed.
-For
temperatures
at
or
above
130
ºF,
this
term
is
set
equal
to
zero.
For
later
versions
of
this
algorithm:
WeatherLink
uses
144
ºF
as
the
threshold;
Vantage
Pro2console
firmware143
ºF.
This
is
based
on
a
best-
fit
regression
of
the
Steadman
1979
wind
table.
The
differences
are
reflective
of
the
higher
resolution
used in the WeatherLink software.
-
For
temperatures
below
50
ºF
(later
versions
use
the
new
wind
chill
formula
result
here
(calculate
the
wind
chill
increment
using
the
difference
between
the
air
temperature and wind chill)):
--
For
the
earlier
display
console
versions
and
WeatherLink
version5.0
or
5.1:
use
the
wind
chill
calculation as the base temperature.
--For
the
WeatherLink
software
(versions
5.2
through
5.5.1):
use
the
new
heat
index
formula
(as
described
in
the
heat
index
section)
as
the
base
temperature
and
calculate
the
wind
chill
increment
using
the
difference
between
the
air
temperature
and
wind
chill
(which
is
always
a
negative
number).
The
resulting
value
is
the
wind
term,
which
will
be
added
to
the
humidity
term
and
subsequently
the
sun
term
as
indicated
below.
Note:
The
WeatherLink
software(version
5.2
through
5.5.1)
offers
a
variable
does
not
include
the
sun
term
in
its
calculation.
It
shows
the
result
as
the
"THW
Index"or
"Temperature-
Humidity-Wind
Index."
This
value
indicates
the"apparent"
temperature
in
the
shade
due
to
these
factors.
REFERENCES
Steadman,
R.
G.,
1979:
The
Assessment
of
Sultriness,
Part
II:
Effects
of
Wind,
Extra
Radiation
and
Barometric
Pressure
on
Apparent
Temperature.
Journal
of
Applied
Meteorology, July 1979.
"Media
Guide
to
NWS
Products
and
Services",
National Weather Service Forecast Office,
Monterey, CA, 1995.
Quayle,
R.
G.
and
Steadman,
R.
G.,
1998:
The
Steadman Wind Chill: An Improvement over
Present
Scales.
Weather
and
Forecasting,
December 1998.
UV
(Ultra-violet)
Index
-
The
UV
Index
is
a
measure
of
the
amount
of
skin
damaging
UV
radiation
reaching
the
earth's
surface.
The
amount
of
UV
radiation
reaching
the
surface
at
any
given
time
is
primarily
related
to
the
elevation
of
the
sun
in
the
sky,
the
amount
of
ozone
in
the
stratosphere,
and
the
amount
of
clouds
present.
The
UV
Index
can
range
from
0
(when
it
is
nighttime)
to
15
or
16
(in
the
tropics
a
thigh
elevations
under
clear
skies).
UV
radiation
is
greatest
when
the
sun
is
highest
in
the
sky
and
rapidly
decreases
as
the
sun
approaches
the
horizon.
The
higher
the
UV
Index,
the
greater
the
dose
rate
of
skin
damaging
(and
eye
damaging)
UV
radiation.
Consequently,
the
higher
the
UV
Index,
the
shorter
the
time
before
skin
damage occurs.
There
are
several
effects
experienced
as
a
result
of
overexposure
to
UV
radiation:
1)
a
severe
sunburn
following
an
intense
short
term
overexposure,
and
2)
the
more
serious
skin
cancers
developing
after
long
term
overexposure.
Melanoma,
the
more
deadly
of
the
two
types
of
skin
cancer,
occurs
when
the
person
has
been
subjected
to
several
intense
short
term
overexposures.
Non-melanoma
skin
cancers,
which
are
almost
100%
curable,
occur
in
people
who
are
overexposed
for
very
long
periods
of
time,
such
as
construction
workers,
farmers,
or
fishermen.
Long
term
overexposure
to
UV
radiation
has
been
linked
to
the
formation
of
cataracts
in
the
eyes
as
well.
The
UV
Index
forecast
indicates
the
probable
intensity
of
skin
damaging
ultraviolet
radiation
reaching
the
surface
during
the
solar
noon
hour
(11:30-12:30
local
standard
time
or
12:30-13:30
local
daylight
time).
The
greater
the
UV
Index
is
the
greater
the
amount
of
skin
damaging
UV
radiation.
How
much
UV
radiation
is
needed
to
actually
damage
one's
skin
is
dependent
on
several
factors.
But
in
general
the
darker
one's
skin
is,
that
is
the
more
melanin
one
has
in
his/her
skin,
the
longer
(or
the
more
UV
radiation) it takes to cause erythema (skin reddening).
Wind
Speed
-
Wind
Speed
is
the
current
sustained
wind,
while
Wind
Gust
is
the
current
intermittent
burst
of
wind
speed.
Wind
speed
is
measured
by
the
weather
station's
anemometer.
The
station
calculates
a
10-minute
average
wind
speed
and
a
dominant
10-minute
wind
direction
as
"wind speed."
Wind Gusts - Intermittent bursts of wind are generally
considered to be "gusts" when the wind speed reaches 16
knots or 18.4mph (1 knot = 1.1508 mph) and the variability
of the wind from highest point to lowest is more than 9
knots or 10.4 mph. A gust will usually be defined as less
than 20 seconds in duration and is the maximum speed
reached by the wind. With personal weather stations, the
definition of Gust varies by manufacturer and software
used. Some software packages do not send information on
wind gusts to online weather specialty sites such as
Wunderground.com, so the "gust" reading you will see may
be the highest measured wind reading.
Wind run: Wind run is measurement of the "amount" of
wind passing the station during a given period of time,
expressed in either "miles of wind" or "kilometers of wind".
Wind run is calculated by multiplying the average wind
speed for each archive record by the archive interval.
For Example:
Average Wind Speed = 5 mph
Archive Interval = 30 minutes (0.5 hours)
Wind Run = 5 mph x 0.5 hours = 2.5 miles of wind
Wind
Chill
-
Parameters
Used:
Outside
Air
Temperature
and
Wind
Speed.
Wind
chill
takes
into
account
how
the
speed
of
the
wind
affects
our
perception
of
the
air
temperature.
Our
bodies
warm
the
surrounding
air
molecules
by
transferring
heat
from
the
skin.
If
there's
no
air
movement,
this
insulating
layer
of
warm
air
molecules
stays
next
to
the
body
and
offers
some
protection
from
cooler
air
molecules.
However,
wind
sweeps
that
comfy
warm
air
surrounding
the
body
away.
The
faster
the
wind
blows,
the
faster
heat
is
carried
away
and
the
colder
the
environment
feels.
The
new
formula
was
adopted
by
both
Environment
Canada
and
the
U.S.
National
Weather
Service
to
ensure
a
uniform
wind
chill
standard
in
North
America.
The
formula
is
supposed
to
more
closely
emulate
the
response
of
the
human
body
when
exposed
to
conditions
of wind and cold than the old formula did.
Formulas Implemented:
35.74 + 0.6215T - 35.75 * (V 0.16 ) + 0.4275T * (V 0.16 )
Any
place
where
the
result
yields
a
wind
chill
temperature
greater
than
the
air
temperature,
the
wind
chill
is
set
equal
to
the
air
temperature.
This
always
occurs
at
wind
speeds
of
0
mph
or
temperatures
above
76
ºF.
This
also
occurs
at
lower
wind
speeds
with
temperatures
between
0
ºF
and
76
ºF.
The
new
formula
takes
into
account
the
fact
that
wind
speeds
are
measured
"officially"
at
10
meters
(33
feet)
above
the
ground,
but
the
human
is
typically
only
5
to
6
feet
(2
meters)
above
the
ground.
So,
anemometers
still
need
to
be
mounted
as
high
as
possible
(e.g.,
rooftop
mast)
to
register
comparable
wind
speed
readings
and
wind
chill
values.
Our
newer
version
of
the
formula
addresses
the
fact
that
the
latest
National
Weather
Service
(NWS)
formula
was
not
designed
for
use
above
40
ºF.
The
result
of
the
straight
NWS
implementation
was
little
or
no
chilling
effect
at
mild
temperatures.
This
updated
version
provides
for
reasonable
chilling
effect
at
mild
temperatures
based
on
the
effects
determined
by
Steadman
(1979)
(see
THSW
Index
section),
but
as
with
the
new
NWS
formula,
no
upper
limit
where
chilling
has
no
additional
effect.
This
later
version
for
the
console
table
only
differs
in
that
whole
degrees
and
less
resolution
in
the
table
are
used
for
code
and
memory
space
conservation.
As
with
previous
versions
of
the
wind
chill
formula,
any
place
where
the
result
yields
a
wind
chill
temperature
greater
than
the
air
temperature,
the
wind
chill
is
set
equal
to
the
air
temperature.
This
always
occurs
at
wind
speeds
of
0
mph
or
temperatures
at
or
above
93.2
ºF
(34
ºC).
This
also
occurs
at
lower
wind
speeds
with
temperatures
between
0
ºF
(-18
ºC)
and
93.2
ºF
(34
ºC).
As
per
Steadman
(1979),
93.2
ºF
(34
ºC)
is
the
average
temperature
of
skin
at
mild
temperatures,
thus
temperatures
above
this
value
will
actually
create
an
apparent
warming
effect
(see
THSW
Index
section).
The
Vantage
Pro
and
Vantage
Pro2
console
uses
the
"10-minute
average
wind
speed"
to
determine
wind
chill,
which
is
updated
once
per
minute.
When
10-minute
of
wind
speed
data
is
unavailable,
it
uses
a
running
average
until
10-
minutes
worth
of
data
is
collected.
The
reason
an
average
wind
speed
is
employed
in
the
Vantage
Pro
and
Vantage
Pro2
to
calculate
wind
chill
is
as
follows:
The
human
body
has
a
high
heat
capacity,
thus
high
wind
speeds
have
no
effect
on
the
body's
thermal
equilibrium.
So,
an
average
wind
speed
provides
a
more
accurate
representation
of
the
body's
response
than
an
instantaneous
reading.
Also,
"official"
weather
reports
(from
which
wind
chill
is
calculated)
provide
average
wind
speed,
so
using
an
average
wind
speed
more
closely
matches
the
results
that
are seen in weather reports.
REFERENCES
"Media Guide to NWS Products and Services",
National Weather Service Forecast Office, Monterey,
CA, 1995.
"New Wind Chill Temperature Index", Office of
Climate, Water and Weather Services, Washington,
DC, 2001.
Siple, P. and C. Passel, 1945. “Measurements of Dry
Atmospheric Cooling in Subfreezing Temperatures.”
Proc. Amer. Philos.
Soc. Steadman, R. G., 1979: T”he Assessment of
Sultriness, Part I: A Temperature-Humidity Index
Based on Human Physiology and Clothing Science.”
Journal of Applied Meteorology, July 1979
In 2001, NWS implemented an updated Wind Chill
Temperature (WCT) index. The change improves
upon the former WCT Index used by the NWS and the
Meteorological Services of Canada, which was based
on the 1945 Siple and Passel Index.
**********
In
the
fall
of
2000,
the
Office
of
the
Federal
Coordinator
for
Meteorological
Services
and
Supporting
Research
(OFCM)
formed
a
group
consisting
of
several
Federal
agencies,
MSC,
the
academic
community
(Indiana
University-Purdue
University
in
Indianapolis
(IUPUI),
University
of
Delaware
and
University
of
Missouri),
and
the
International
Society
of
Biometeorology
to
evaluate
and
improve
the
windchill
formula.
The
group,
chaired
by
the
NWS,
is
called
the
Joint
Action
Group
for
temperature
Indices
(JAG/TI).
JAG/TI's
goal
is
to
upgrade
and
standardize
the
index
for
temperature
extremes internationally (e.g. Windchill Index).
The
current
formula
uses
advances
in
science,
technology,
and
computer
modeling
to
provide
a
more
accurate,
understandable,
and
useful
formula
for
calculating
the
dangers from winter winds and freezing temperatures.
(click on chart for a larger version)
Clinical trials were conducted at the Defense and Civil
Institute of Environmental Medicine in Toronto, Canada,
and the trial results were used to improve the accuracy of
the new formula and determine frostbite threshold values.
Standardization of the WCT Index among the
meteorological community provides an accurate and
consistent measure to ensure public safety. The new wind
chill formula is now being used in Canada and the United
States.
Specifically, the new WCT index:
Calculates wind speed at an average height of five
feet (typical height of an adult human face) based on
readings from the national standard height of 33 feet
(typical height of an anemometer)
Is based on a human face model
Incorporates modern heat transfer theory (heat loss
from the body to its surroundings, during cold and
breezy/windy days)
Lowers the calm wind threshold to 3 mph
Uses a consistent standard for skin tissue resistance
Assumes no impact from the sun (i.e., clear night sky)
Note: Wind Chill Temperature is only defined for
temperatures at or below 50 ºF and wind speeds above 3
mph. Bright sunshine may increase the wind chill
temperature by 10 to 18 ºF.
To view the NWS brochure about the new wind chill
temperature index, click here.
For more information visit:
https://www.weather.gov/safety/cold
More Definitions